Globe Viewer Outlook
GlobeViewer development began more than 5 years ago. I am currently working on a complete redesign of the project to significantly improve the display quality of the 3D tiles. Here is a brief insight into the current prototype and the changes that will later be available in the app. The new version will be released in the second half of 2024, so please be patient. You can read why this is taking so long below.
Update: Version 0.12.0 has been released on Android, iOS, Windows and MacOS.
Thank you for your understanding!
More memory available
Since GlobeViewer development began in 2017, (mobile) technology has evolved considerably. At that time, very little main memory (approx. 250 MB) was available for apps on devices. If this limit was exceeded, the app was immediately terminated by the operating system, which significantly limited the number and resolutions of textures that could be loaded in the app at the same time.
The definitions for available texture sizes on the 3D tiles came from this time, so that each tile only allowed a 512x512 pixel texture for the height coloring and a 1,024x1,024 pixel texture for the surface normal map. The maximum for textures today is 4,096x4,096 pixels - only a few of these could be loaded back then before major problems arose. New texture formats (which can also be displayed compressed on mobile devices) and more available memory for apps now allow a redefinition of texture sizes.
Better screen resolutions and more performance
The first iPad generations came out with a 1,024x768 screen resolution. Today, almost all devices work with at least FullHD or 4K resolutions and more. In order to be able to calculate these pixel quantities smoothly, the computing power has also increased considerably. This means that significantly more effects and more complex shaders can be used for graphic representation today than back then. However, the performance is distributed very differently across the many available device classes. There will therefore have to be a gradation of the representation in the app in order to keep the app running on as many devices as possible.
Current map data with more details
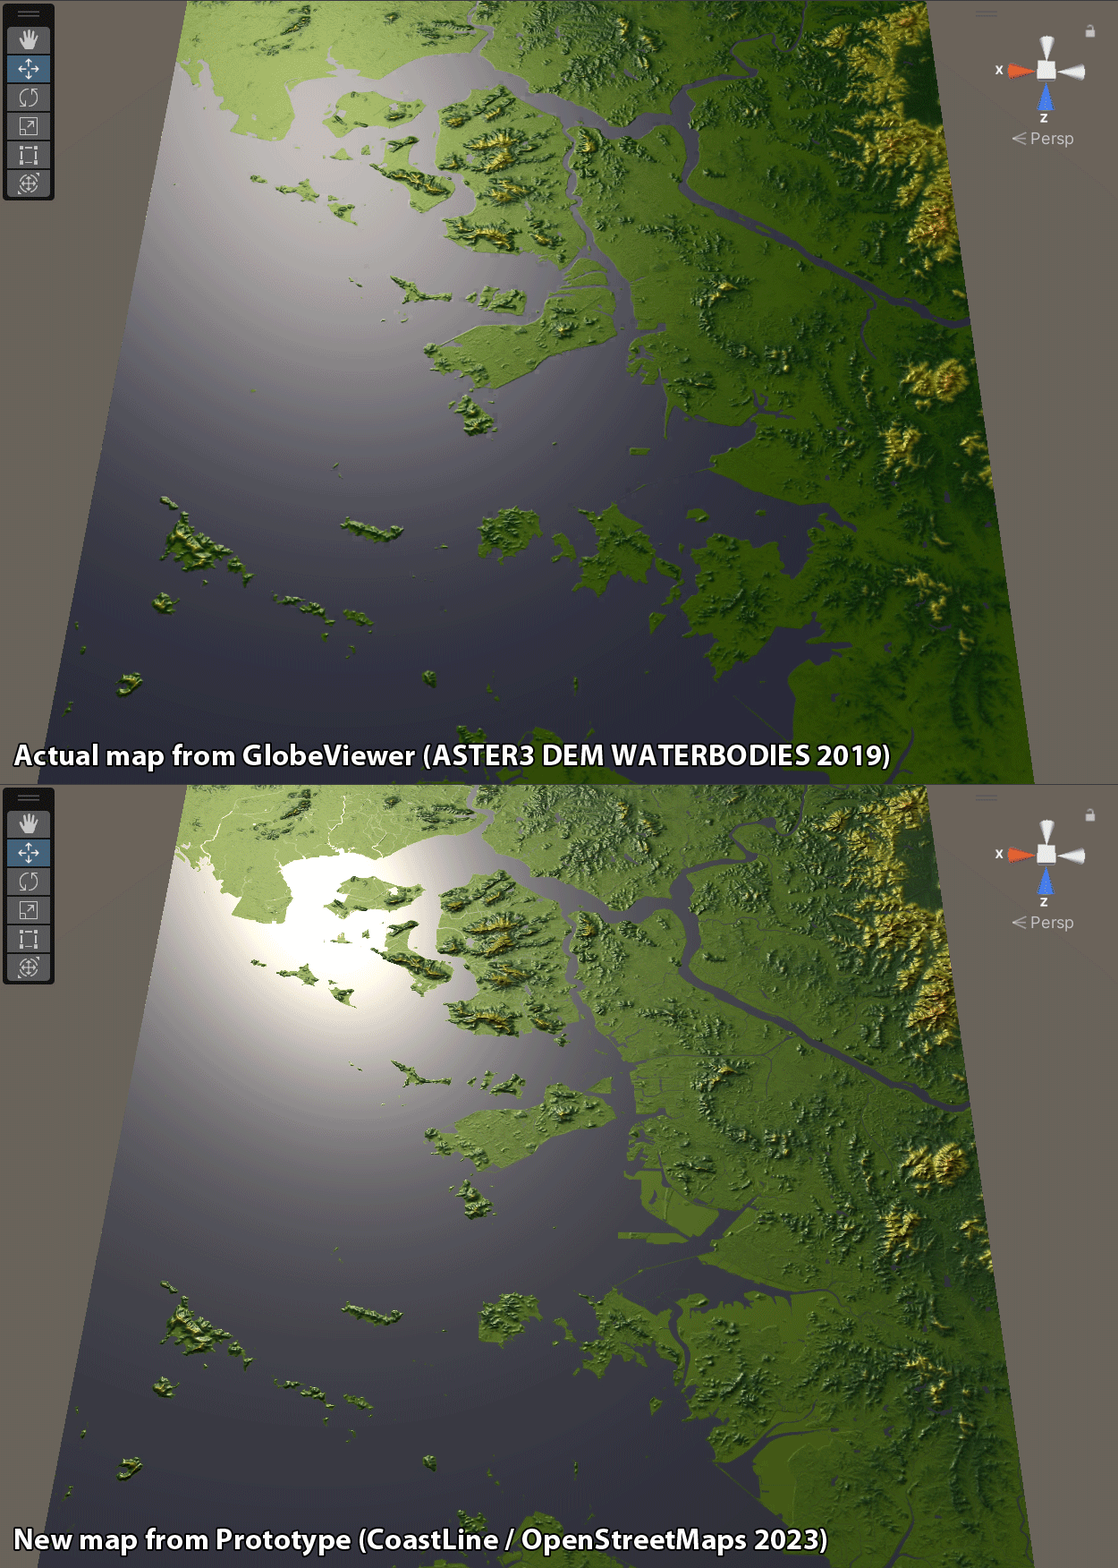
The earth has also changed, and this is most clearly seen in the coastline. Here is an example of how the coastline near Seol has changed due to land reclamation in the last 5 years. So it is high time to update the maps.
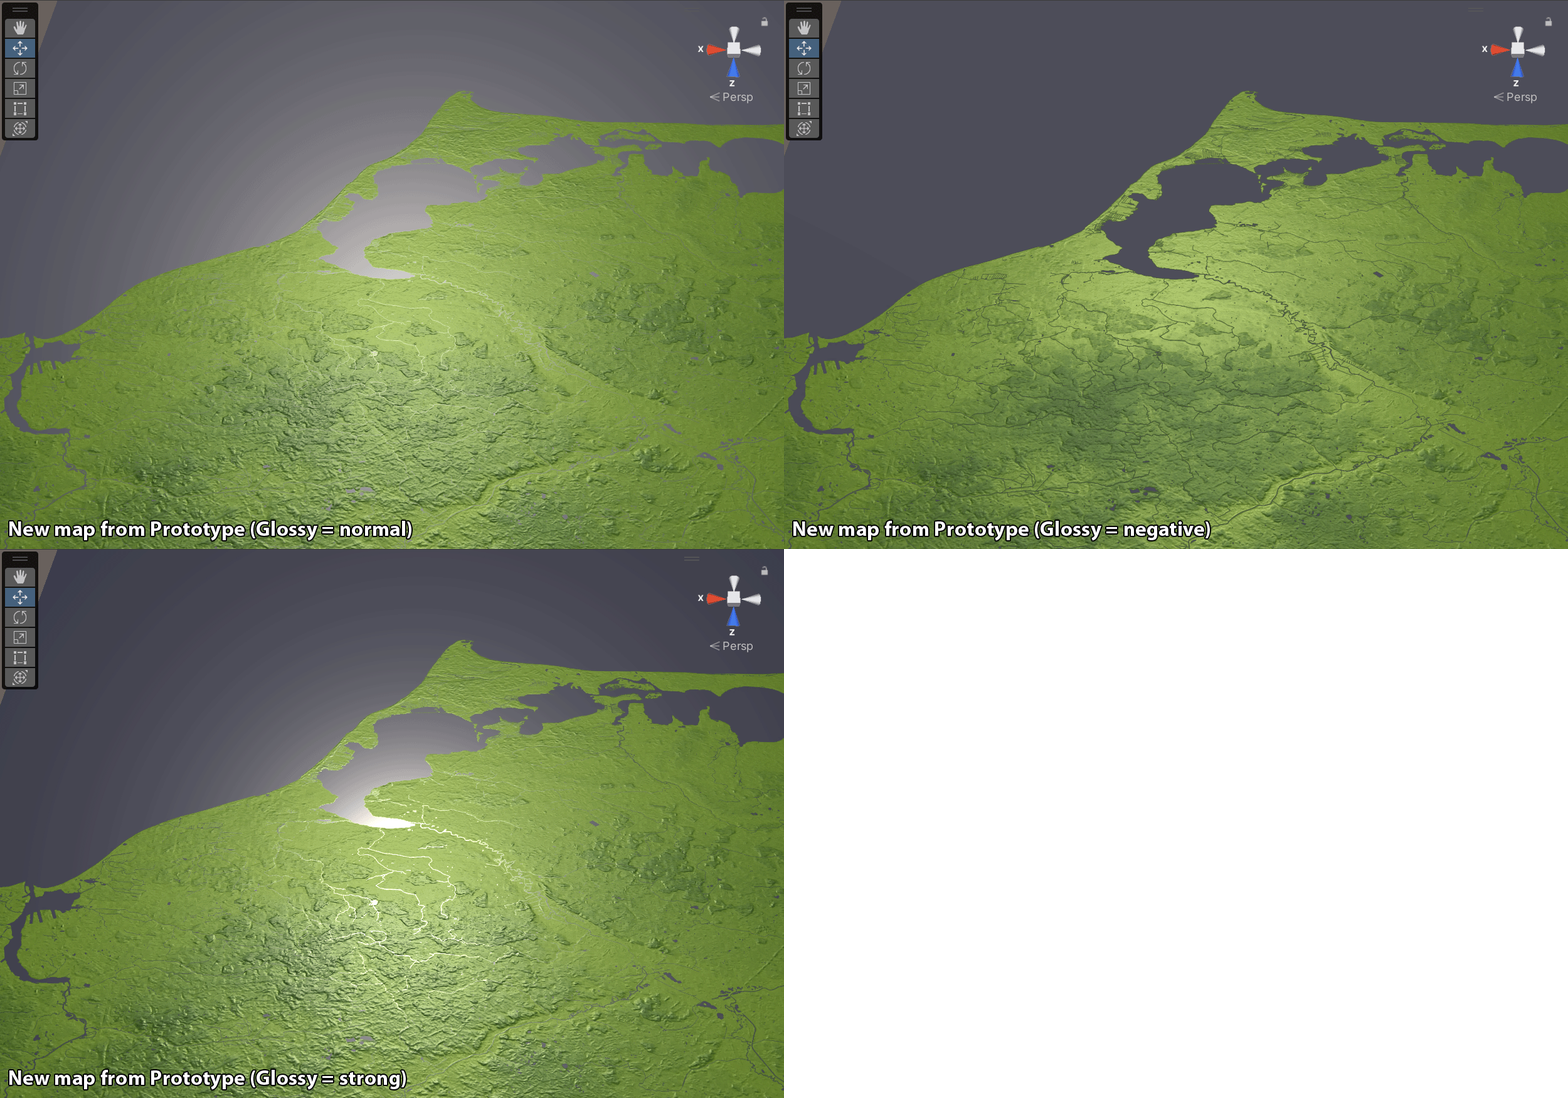
Redefining the textures also offers the opportunity to include more information on the textures. For example, rivers are currently missing from the height textures. It makes a big optical difference whether a river reflects the light or not:
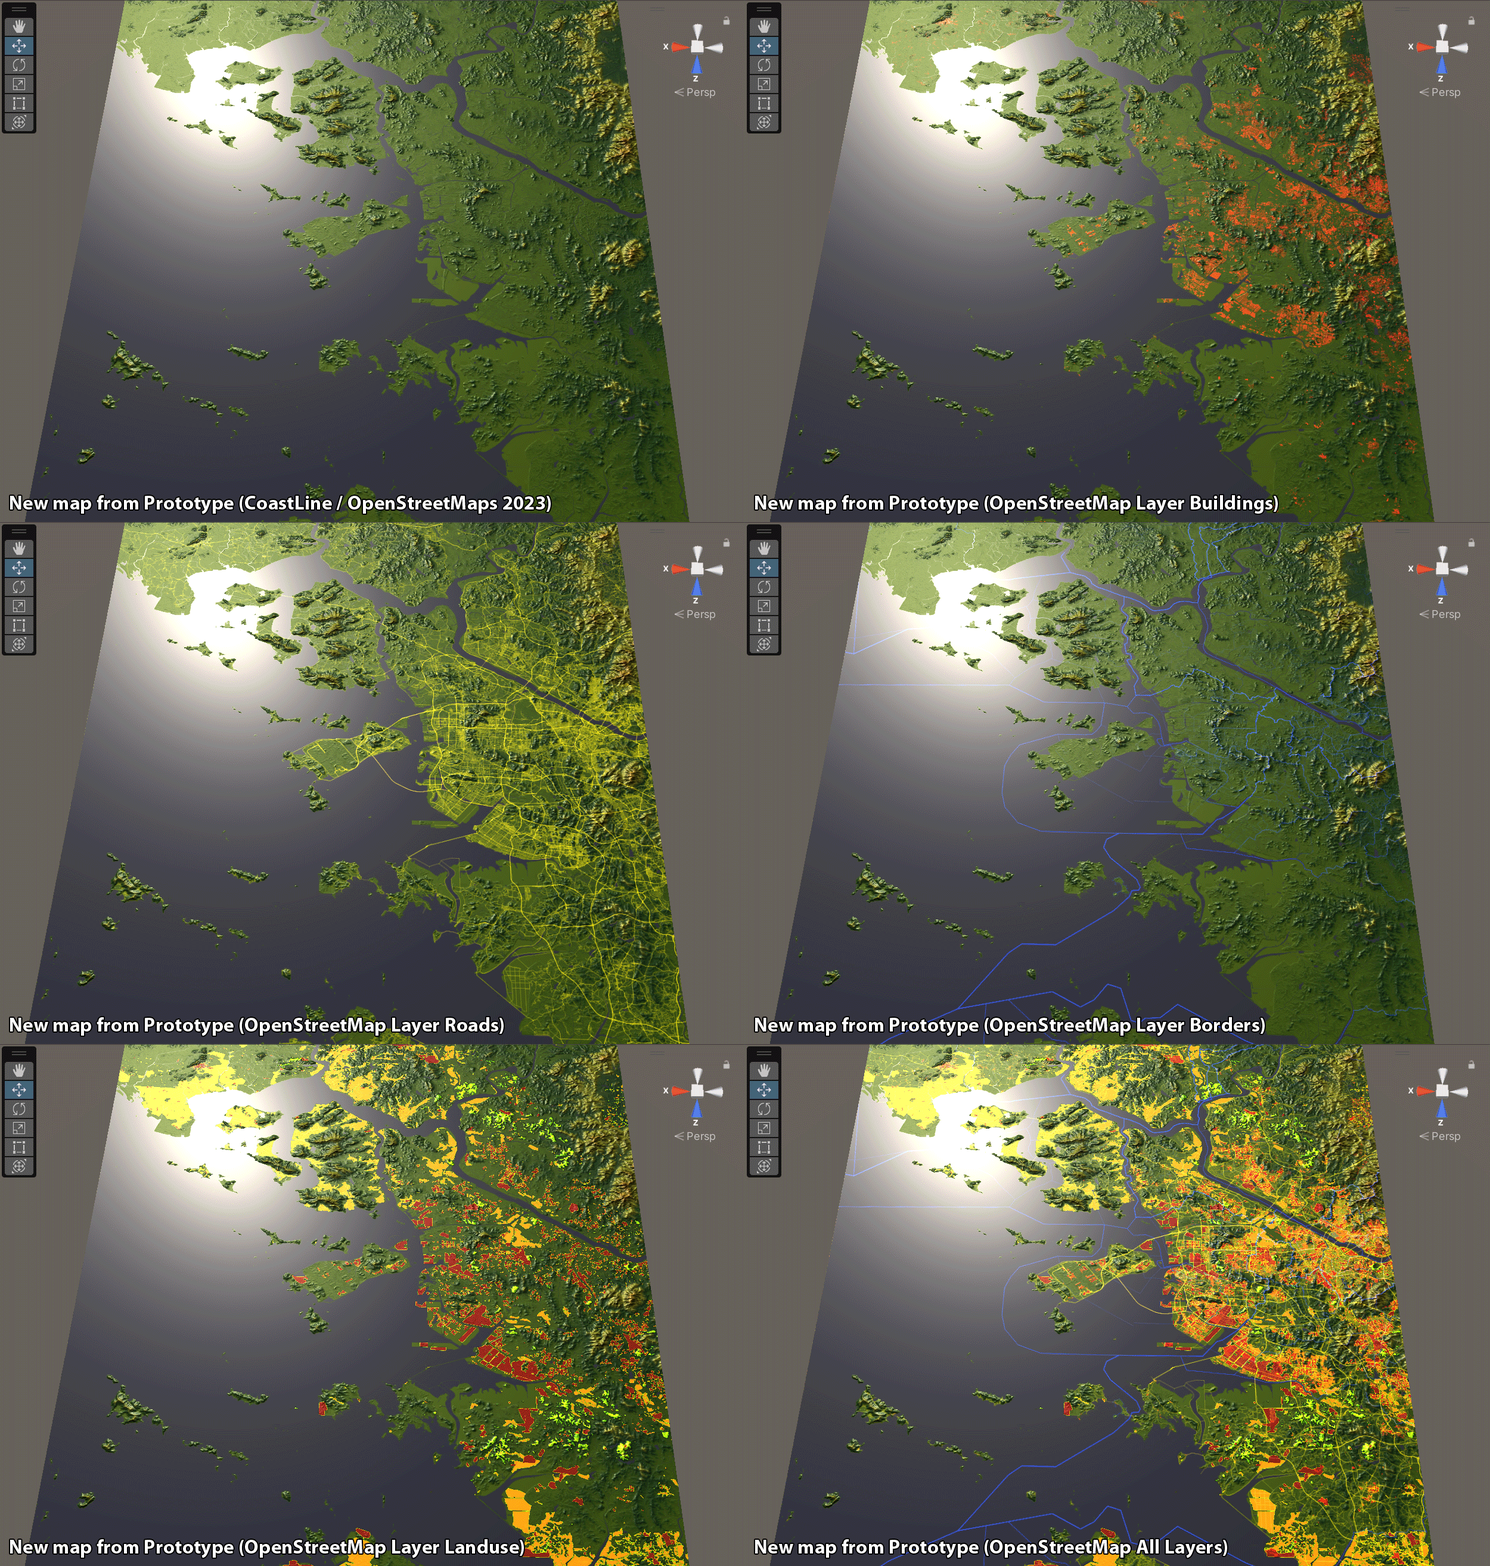
Streets, borders and, for example, land use can also be included in the textures. These can then simply be displayed on the height map.
Division of the map
The map is divided into 22,912 tiles. To ensure that sensibly connected areas are processed together, it is divided into zones.
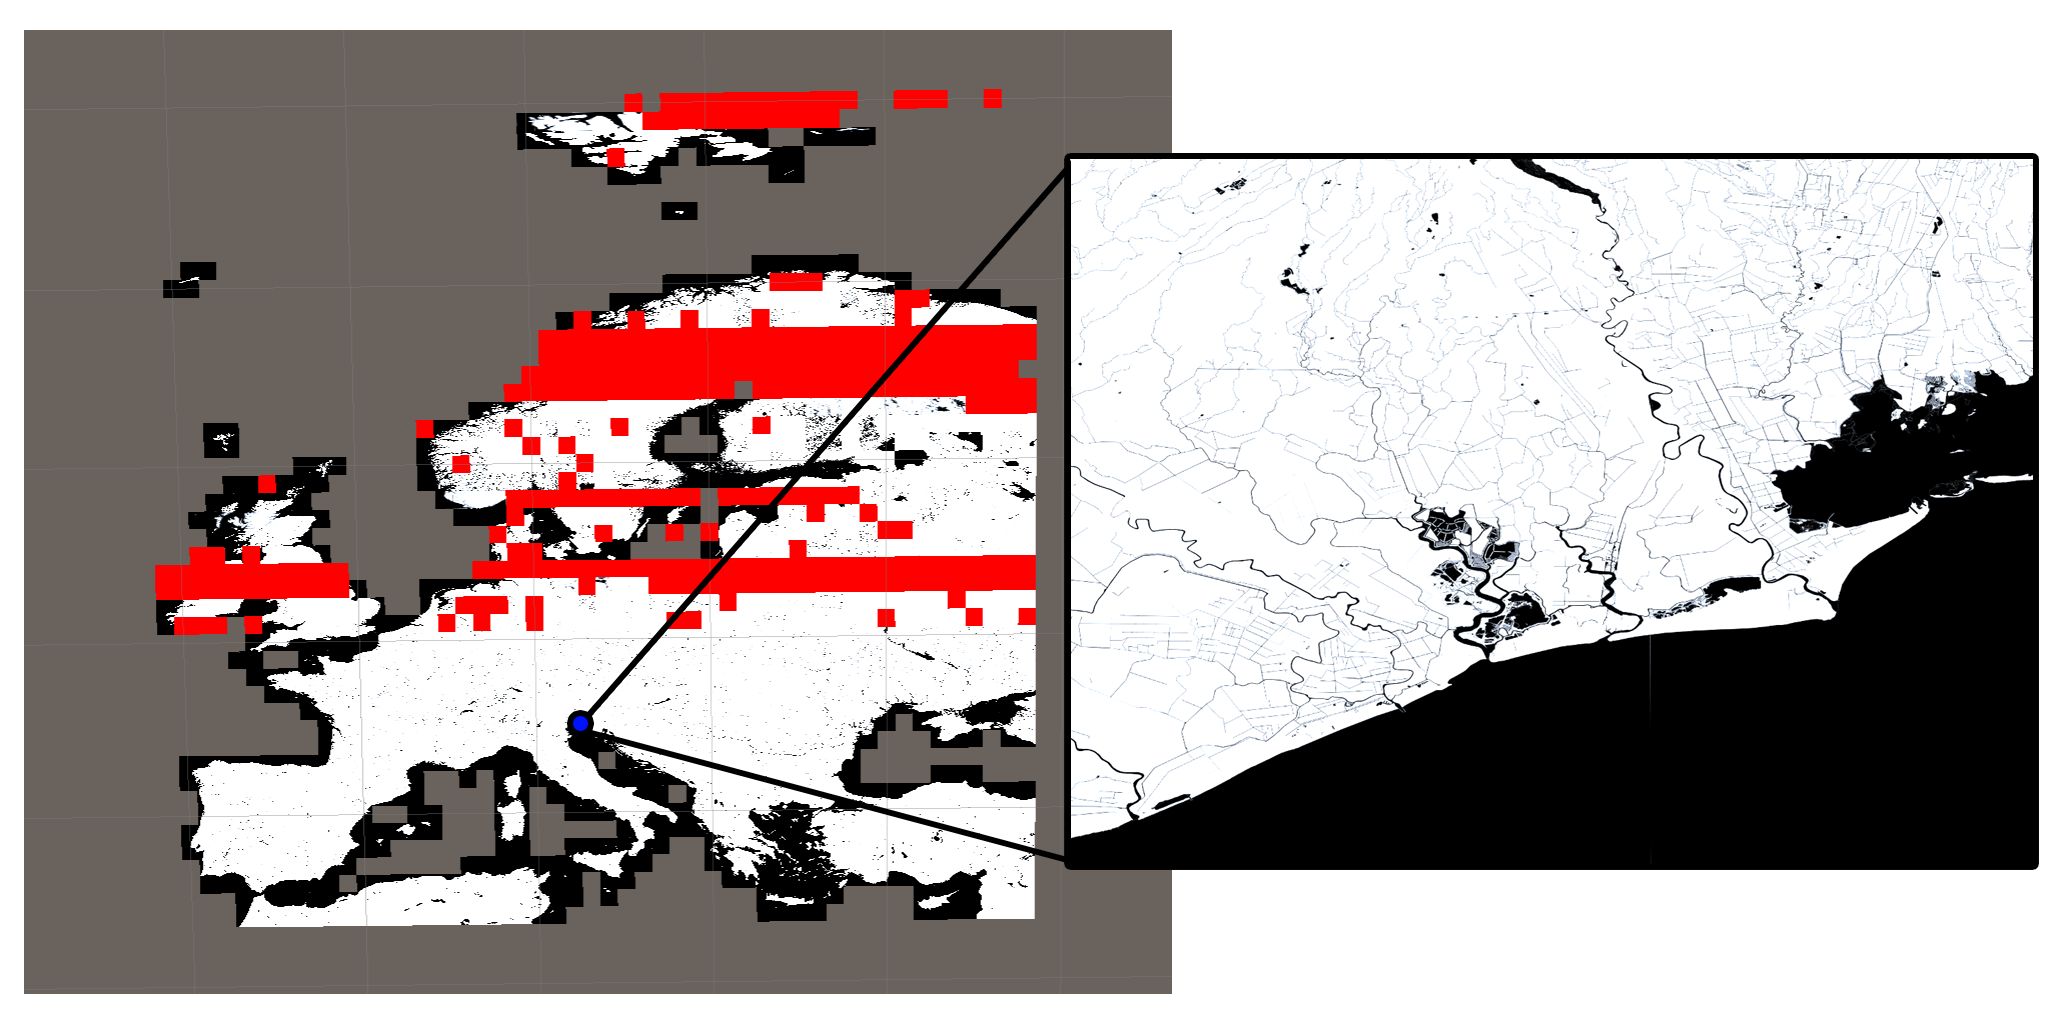
Europe & water course in detail (Enlarged: Bibione Pineda/Venice)
Development steps for the next version
- Adjust elevation data - DONE
- The ASTER elevation data is already available as 3,601x3,601 data. These are scaled up to 4,096x4,096.
- Create data layer (data export from OpenStreetMap via QGIS rendered as 4,096x4,096 textures) - DONE
- Waterways and coastlines
- Border lines
- Roads and railway lines
- Development
- Land use (agriculture, forestry, villages)
- Shader definition and texture creation - FINISHED
- The shader for the display in Unity is specified
- The textures are then brought into the required form
- Import into Unity and processing - FINISHED
- Specifying the Unity version used: for now it will stay the same 2022.3 (May 2024)
- Defining the texture sizes per platform (probably 2,048x2,048 due to storage space and download times)
- Specifying the Unity version used: for now it will stay the same 2022.3 (May 2024)
- Export of the addressables from Unity3D -in progress
- Testing the export
- Complete export and server upload (iOS, Android, Mac, Windows)
- Version building - in progress
- Loading the new addressables from the server
- Switching the UI display options to the new shader
Texture creation and optimization completed
In this step, two composite textures are created from the previously created individual textures. The color channels are put together in such a way that we can accommodate the maximum amount of information in the available color channels. This keeps the amount of data to be transferred manageable. We have 4 color channels (RGBA) available for each texture.
- Color texture
- The color texture contains the color gradients of the elevation data in RGB. All water surfaces and the coastline are blended into this color texture. Since the land use can only ever belong to one group (urban area, agriculture, forest use), all three groups are stored in the alpha channel with different brightness levels. The shader used can then separate the three groups in the software and color them accordingly.

- Structural texture and normal map
- The remaining data (roads, railways, borders and buildings) can overlap. Therefore, these textures must be saved as individual layers. Each layer is therefore placed in a channel of the structural texture. A normal map is calculated for the height details, which then manipulates the lighting as if geometry were present. In fact, only the direction of the light is manipulated. This technique saves a lot of geometry data and saves a lot of time on the graphics calculation.

- Shader connects all textures
- The shader allows the user to display exactly the information they want. This makes it easy to overlay the different texture layers on the map and to easily adjust the strength of the surface details, the height coloring and the highlight.
Current status July 2024
The data is now being repackaged and prepared for export. Here, the amount of data per platform must be brought into line with the storage space available on the server. Previously, we only had 2 textures per tile (color texture in 512x512 and normal texture in 1024x1024 pixels). Now we also have the additional structure texture, so three textures per tile.
Although all textures are available in 4096x4096 pixels, we can only work with 1024 (color) / 1024 (normal) / 2048 (structure) resolutions in the app. Otherwise, the amount of data per tile will be too large. Previously, we had a maximum of 2.5 MB per tile, now it is up to 9 MB for one tile. This adds up to 105 GB for all tiles. Previously we were at 33 GB. Unfortunately, the download times for the tiles are associated with longer waiting times with slow internet connections and there should be significantly more free storage space on the smartphone for offline storage in the cache.
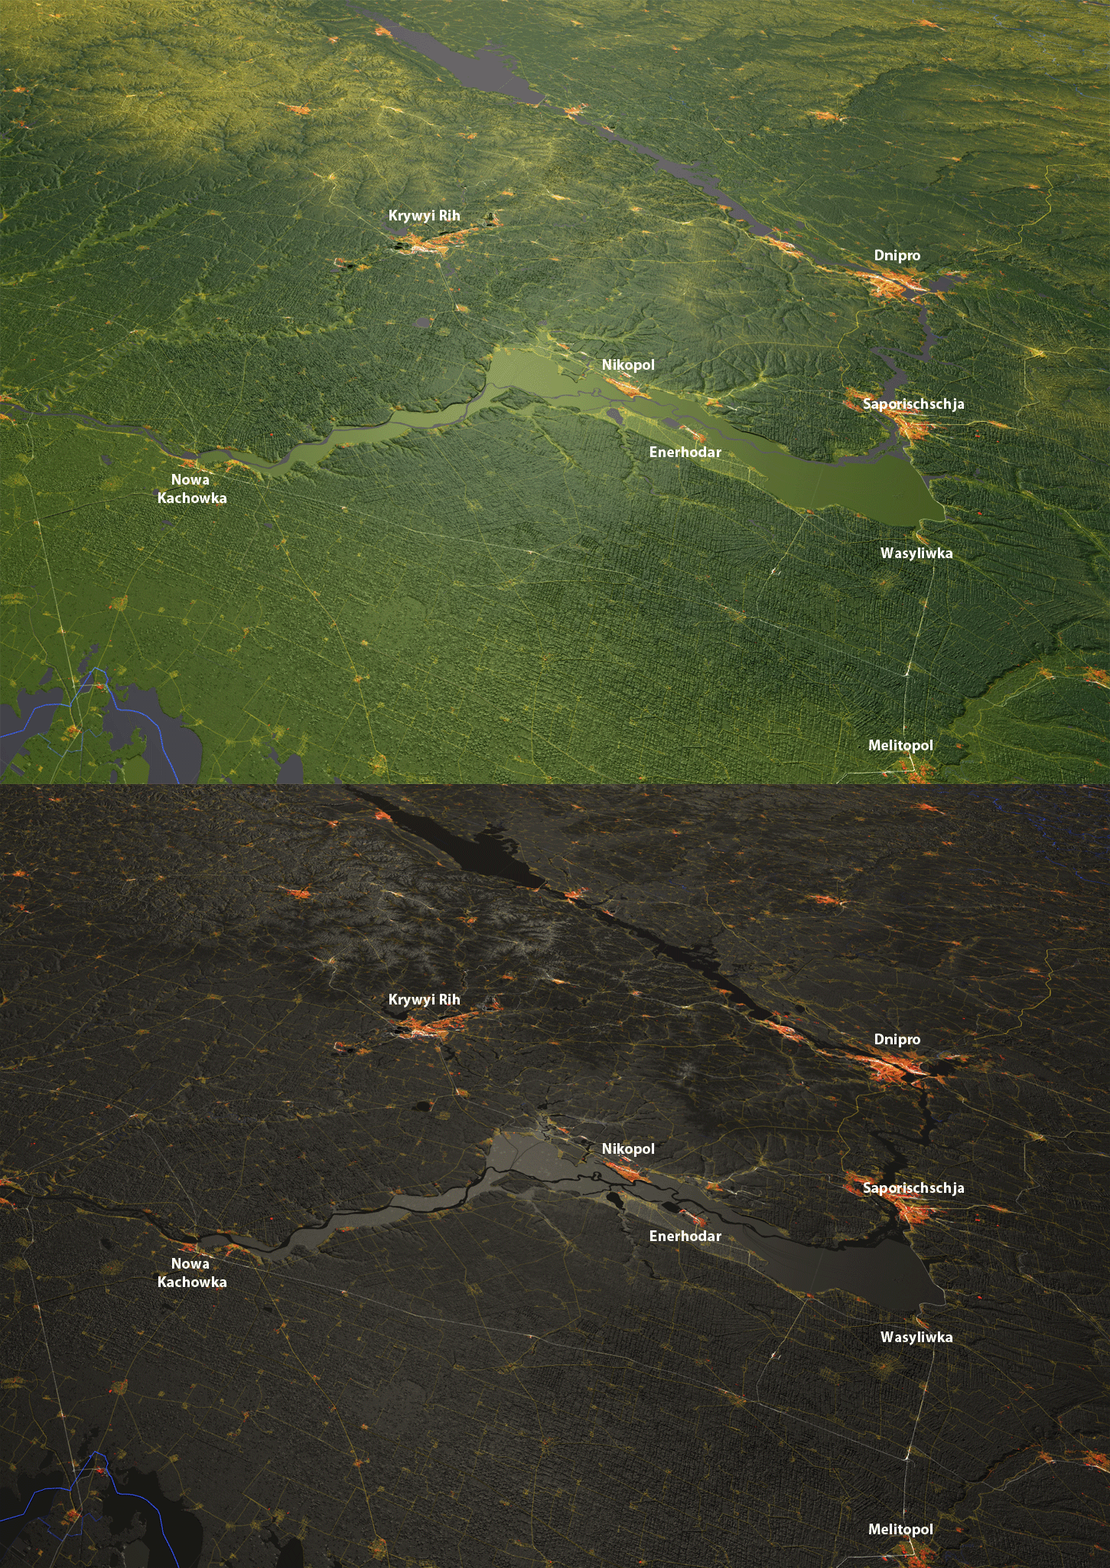
Attached is a current image of the data from the destroyed Kachowka reservoir. The elevation data comes from the time when the dam was intact, so there is no data there. It is only possible to subsequently smooth out areas with water in the elevation data, but without new data no elevation profile can be shown there. The roads, railways and buildings have been superimposed. I am also experimenting with a new view here to make the structures more visible on the map. Now the user can choose the color combination of the individual elements themselves.
Final spurt
In the next few weeks I will test the versions for Android and iOS and prepare them for release. Mac and Windows will follow afterwards. But first the old data must be removed from the server as soon as the new versions have been released... otherwise I won't have enough space on the server.

